The example shows demo data created for five years for our demo company – PrecisionPump Engineering, from 290 sales transactions. It shows a fully operational dashboard, with filters and click-throughs, on each of the graphs, built in Metabase which we built to show the interplay between defining the metrics based on the Diagnostics of the company, and what the different layers of management needs to control.
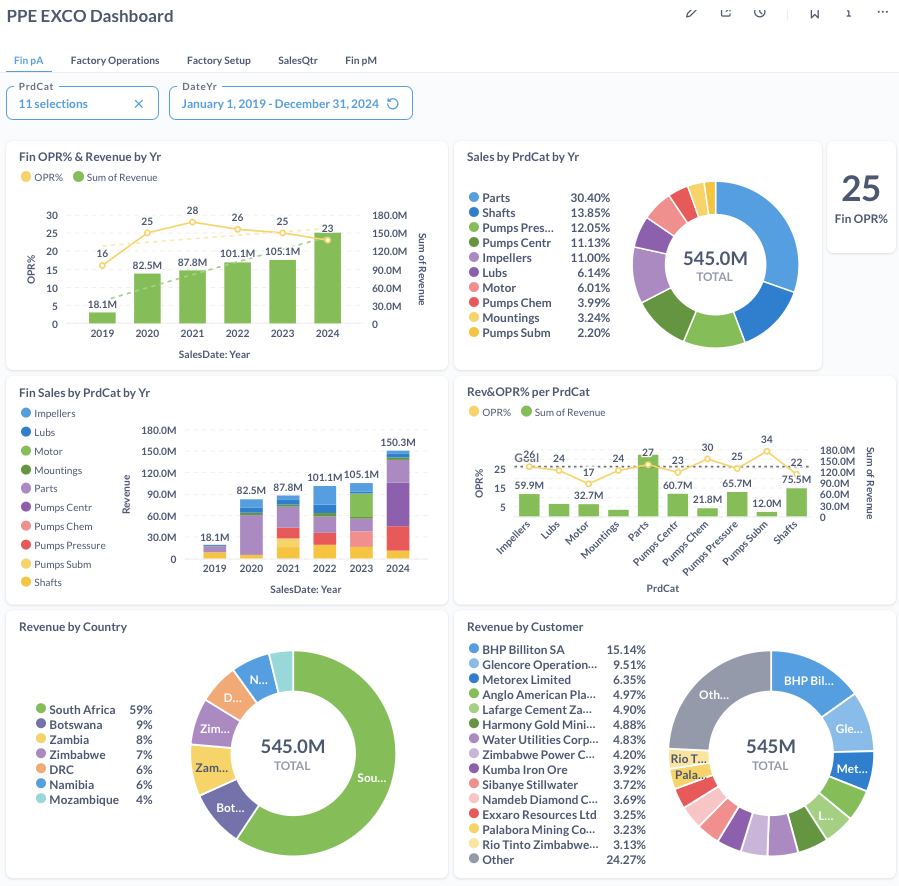
This dashboard shows the big picture – Financials – revenue and operating profit % per Year, and alternative views of the same data, per product category, sales per country, and revenue per customer.
We can see the following from this EXCO dashboard:
- The operating profit jumped to 28% in 2021, but have dropped steadily to 23% in 2024.
- ~30% of the revenue over 5 years came from parts, returning the highest margin, namely 27%.
- Clients in South Africa made up ~60%, with client BHP leading with 15% of the sales.
In order to further understand the issues – this dashboard can be clicked-through on every graph – or even element on a graph (like a year – to see the monthly details for instance).
Conclusion – this company is in trouble – with OPR% dropping to 23% in 2024 – it will require turn-around interventions – or it will go bust.
Book a meeting with us – to get your life access to this demo system !